- This topic has 0 replies, 1 voice, and was last updated 3 months, 2 weeks ago by
 Bob Kuczewski.
-
AuthorPosts
-
April 15, 2026 at 8:18 PM #2234
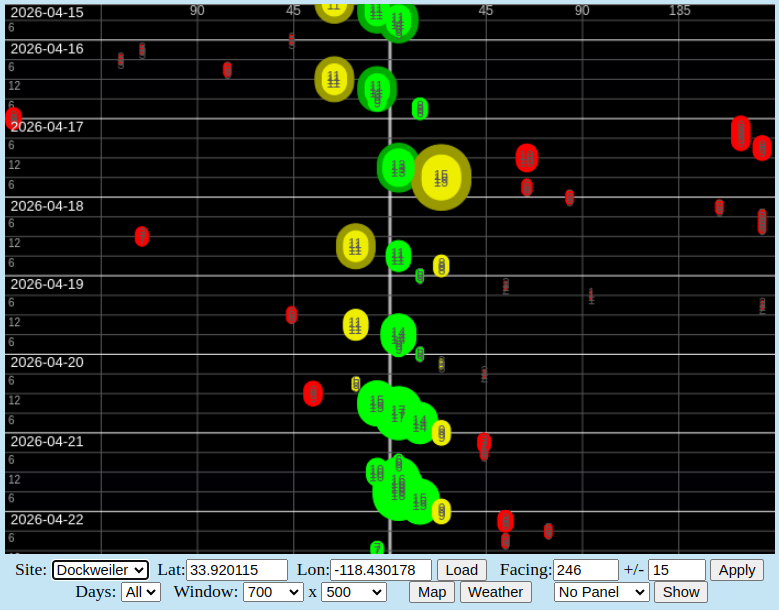
Back in 2022 I began writing a Javascript program to show wind direction and speed relative to launch (first published in December of 2023). The idea was to make it easier to visualize these values by portraying them as they might appear on launch. Each wind velocity value is displayed as a circle (blob) appearing to the left, center, or right of launch direction. The size of each blob reflects the speed, and the color reflects various user-selectable angle limits (green, yellow, and red). I’ve recently updated the program to include gust rings and precipitation. You can find the current program at:
You can read about the operation and history of the program here:
The short description is that you want to see good sized green blobs in the center of the screen. Here’s the forecast for next 7 days at Dockweiler:
And here’s the forecast for the next 7 days at Sylmar:
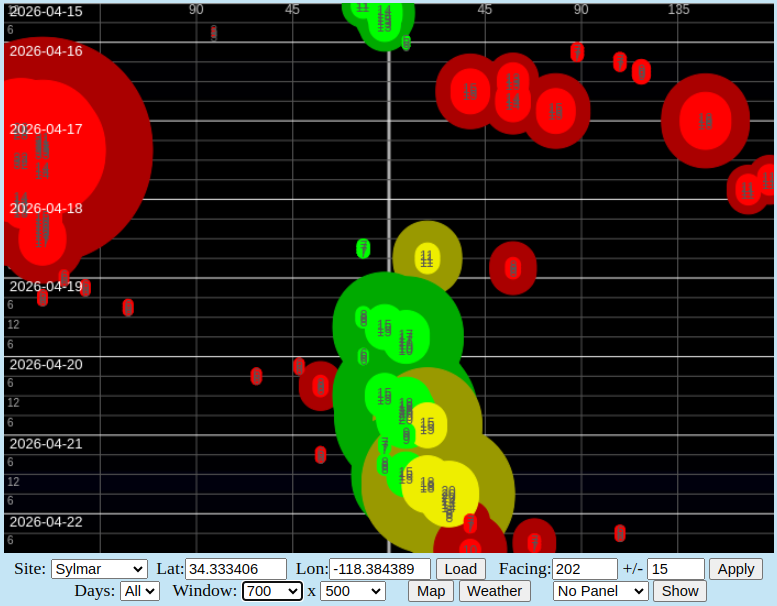
At a glance, you can see that it should be good today (April 15, 2026) and on April 19th through April 21st (with a bit more right cross on the 21st).
The default image size is designed to fit on a typical screen, and that’s good for a quick view. But the wind speed numbers tend to overlap at that screen size. The image sizes can be adjusted in width and height to get a better view. Here’s that same Sylmar forecast vertically expanded to improve legibility:
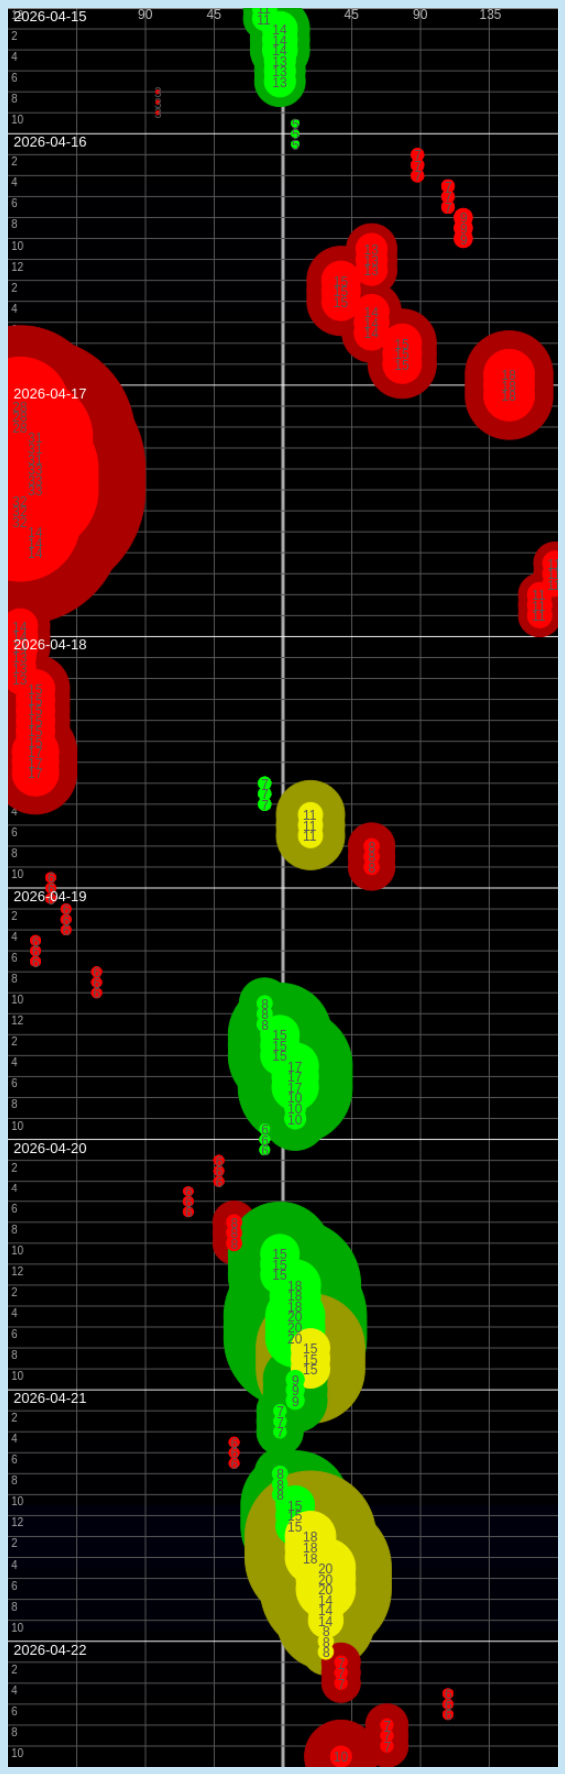
The expanded view allows you to better read the individual wind speed numbers and get more accurate times of day.
-
AuthorPosts
- You must be logged in to reply to this topic.